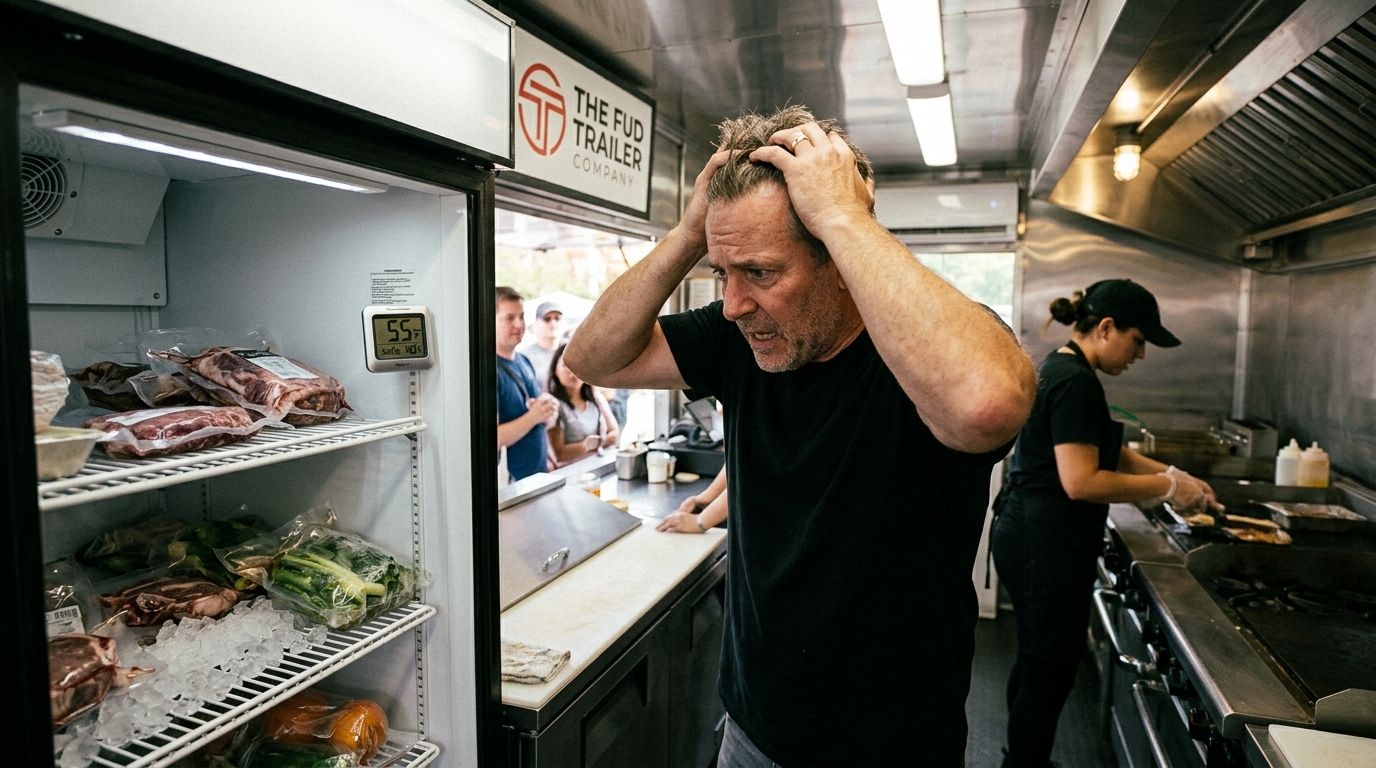
You just bought the perfect food trailer.
Premium equipment. Clean kitchen. Eye-catching design. You’re ready.
Then you park it.
And… nobody comes.
You move it across town. Still nothing. Third location. Same problem.
Now you’re thinking: “Maybe this business doesn’t work.”
Wrong diagnosis. The trailer works. The location didn’t.
Here’s the truth: 90% of food trailer success isn’t about the food. It’s about WHERE you park.
I’ve seen mediocre trailers in gold-standard locations make $2,000/day. And premium trailers in dead zones make $300/day.
The difference? Location strategy.
This is your complete guide to finding, validating, and securing food trailer locations that actually generate revenue—not just foot traffic, but PAYING customers.
The Math: Why Location Is 60% Of Your Success
The Breakdown:
- Equipment/Trailer Quality: 10%
- Food Quality/Menu: 20%
- Marketing/Social: 10%
- Location: 60%
Why? Because location determines:
✓ Daily Customer Volume: A good location brings 500+ potential customers daily. A bad one brings 50.
✓ Customer Type: Is your customer a construction worker (breakfast/lunch) or college student (late night)? Location determines who shows up.
✓ Competition Density: Are you the only food option or one of 10? Location decides.
✓ Rent/Permit Costs: Good locations have variable costs. Bad locations seem cheap but generate zero revenue.
Real Math:
Location A: High foot traffic area
- 500 potential daily customers
- 5% conversion = 25 customers/day
- $15 average ticket = $375/day = ~$9,000/month
Location B: Dead zone
- 50 potential daily customers
- 15% conversion (because food is better) = 7 customers/day
- $15 average ticket = $105/day = ~$2,100/month
Same trailer. Same food. Different location = 4.3x revenue difference.
The 5 Location Types: Which Is Right For You?
LOCATION TYPE #1: Street Locations (Permanent or Semi-Permanent)
What It Is:
Parking spot on a busy street. Public sidewalk location. High foot traffic.
Examples:
- Downtown corridor
- Beach/waterfront promenades
- Shopping districts
- Busy intersections
Pros:
✓ High visibility
✓ Consistent daily foot traffic
✓ Good for lunch/dinner rush
✓ Repeat customers (same spot = predictability)
Cons:
✗ Permits often required (and competitive)
✗ Higher location costs ($500-$2,000+/month)
✗ Weather dependent (rain kills sales)
✗ City regulations strict
Best For:
Established operators with strong food + willing to navigate bureaucracy.
Revenue Potential: $1,500-$2,500/day (high foot traffic areas)
LOCATION TYPE #2: Event-Based Locations (Festivals, Markets, Farmers Markets)
What It Is:
Pop-up at recurring events. Farmers markets, street festivals, concerts, sports events.
Examples:
- Weekend farmers markets
- Street festivals (monthly/quarterly)
- College campus events
- Concert series in parks
- Sports venue (stadium parking lot)
Pros:
✓ Pre-screened customer base (people are already there to spend)
✓ High conversion rates (festive atmosphere = more purchases)
✓ Lower location competition (limited booth slots)
✓ Flexible commitment (weekly, not yearly)
Cons:
✗ Inconsistent income (event-dependent)
✗ Booth fees ($50-$500 per event)
✗ Setup/breakdown time
✗ Weather cancellations
Best For:
Flexible operators testing menus + building customer base.
Revenue Potential: $800-$1,500/event (depends on event size/quality)
LOCATION TYPE #3: Corporate/Office Park Locations
What It Is:
Lunch service at office parks, tech campuses, business districts.
Examples:
- Tech company campuses (Google, tech startups)
- Office parks
- Medical complexes
- Business districts
Pros:
✓ Captive audience (employees can’t leave for lunch)
✓ Consistent daily demand (lunch rush = predictable)
✓ Higher average ticket (corporate workers spend more)
✓ Loyal repeat customers
Cons:
✗ Limited to lunch hours (11am-2pm typically)
✗ Requires approval from property management/company
✗ Competitive (popular locations have waiting lists)
✗ Limited days (weekends/holidays = zero revenue)
Best For:
Operators comfortable with lunch-only model + willing to build relationships with corporate contacts.
Revenue Potential: $1,000-$1,800/day (lunch rush concentrated)
LOCATION TYPE #4: Parking Lot Locations (Retail Centers, Gas Stations)
What It Is:
Permitted spot in busy parking lot. Retail center, gas station, shopping complex.
Examples:
- Walmart parking lot
- Gas station lots
- Shopping center parking areas
- Home Depot/Lowes parking lots
Pros:
✓ Moderate foot traffic (people shopping anyway)
✓ Lower competition often
✓ Easier permits than street locations
✓ All-day traffic potential (not just lunch)
Cons:
✗ Less visibility than street
✗ Requires property owner approval
✗ May require percentage of sales to property owner
✗ Can be dead zones if foot traffic low
Best For:
Operators in secondary markets (not major downtown areas).
Revenue Potential: $600-$1,200/day (depends on retail traffic)
LOCATION TYPE #5: Private Events (Catering, Parties, Corporate Events)
What It Is:
No permanent location. You go where the customers are. Weddings, private parties, corporate catering.
Examples:
- Wedding catering
- Birthday parties/quinceañeras
- Corporate team events
- Private park rentals
Pros:
✓ High ticket prices ($30-$50+ per person)
✓ Less location competition
✓ Flexible scheduling
✓ Repeat bookings from satisfied clients
Cons:
✗ Inconsistent volume (booking-dependent)
✗ Requires strong sales/networking
✗ Requires different business model (catering vs walk-up)
✗ Higher operational complexity
Best For:
Sales-oriented operators or those with existing networks.
Revenue Potential: $2,000-$5,000/event (but fewer events = variable income)
The Golden Location Criteria: 5 Metrics That Matter
CRITERIA #1: Foot Traffic Volume
What To Measure:
How many people walk past per day?
Ideal Threshold:
- Minimum: 300 daily potential customers
- Target: 500+ daily potential customers
- Gold: 1,000+ daily potential customers
How To Measure:
- Stand at location 2-3 hours, count people walking by
- Walk similar time slot on 2-3 different days (get average)
- Ask other vendors “typical daily traffic?”
- Use Google Popular Times (busy hours visible)
Real Example:
Downtown street location: 800 people/day walking by
Parking lot in suburban area: 200 people/day
→ Downtown is 4x higher potential
CRITERIA #2: Target Customer Demographics
Ask Yourself:
- Who buys my food?
- What income level? Age range? Profession?
- Do they have time for food truck? Budget for it?
Match Location To Customer:
- Blue-collar workers → near construction sites, warehouses (lunch 11:30-12:30)
- Corporate workers → office parks (lunch noon-1pm)
- College students → campus/downtown (lunch + dinner)
- Tourists → beach/downtown (all day)
- Families → parks, events (weekends)
Example Mismatch (Why It Fails):
You have premium, expensive tacos ($12-15 each). You park in blue-collar construction zone where workers have $8 budget.
Result: No sales. Wrong demographic.
CRITERIA #3: Competition Density
What To Evaluate:
How many other food vendors in the area?
Green Light: 0-1 other food vendors
Yellow Light: 2-3 other vendors
Red Light: 5+ food vendors competing for same customers
Important Caveat:
Some competition is GOOD. Means validated demand. But too much = everyone starves.
Assess Competitive Advantage:
If 5 taco trucks in same area:
- Are you faster? Cheaper? Unique menu? Better quality?
- Or are you identical to competition?
→ Identical = death
→ Differentiated = survival possible
CRITERIA #4: Accessibility + Visibility
Visibility:
Can people SEE you from passing traffic?
- Street corner = high visibility
- Hidden in parking lot back = low visibility
- Right at parking lot entrance = high visibility
Accessibility:
Can people easily STOP and buy?
- Easy parking nearby? High accessibility
- “Can’t stop here” zone? Low accessibility
- Safe to cross street? Easy access to trailer? Matters
Real Impact:
Same foot traffic, but hidden location = 30-40% lower conversion.
CRITERIA #5: Local Regulations + Permit Feasibility
Critical Questions:
- Does city/county ALLOW food trailers in this location?
- What permits required? Cost? How long to get?
- Are permits consistently granted or inconsistently denied?
- What health department rules apply?
- Can you legally operate 7 days/week or limited days?
Reality Check:
Some locations have permits impossible to get. Some have waiting lists 12+ months. Some require expensive health inspections monthly.
Example:
Location looks perfect. But city only gives permits Mon-Fri, 11am-2pm. Your afternoon/weekend revenue = zero.
The Validation Process: How To Test Before Committing
STEP 1: Scout The Location (2-3 Hours)
Visit at your target time. Observe:
- How many people actually pass by?
- What type of people? Do they match your target?
- What are they doing? (Eating? Working? Just passing?)
- Are they stopping at other food vendors?
- Safety? Cleanliness? Vibe?
STEP 2: Talk To Existing Vendors (If Present)
Ask other food vendors in the area:
- “How’s business here?”
- “What time is busiest?”
- “What sells best?”
- “Any location downsides I should know?”
Red Flag: If existing vendors seem discouraged or won’t talk.
Green Light: If they’re honest about challenges but profitable.
STEP 3: Research Regulations + Permitting
Call city/county health department:
- “Can food trailers operate here?”
- “What permits needed?”
- “Cost? Timeline?”
- “Any restrictions on days/hours?”
Budget: Assume $500-$2,000 in permit costs + 4-8 weeks for approval.
STEP 4: Calculate Economics
Revenue Estimate:
- Foot traffic observed × estimated conversion (5-15%) × average ticket = daily revenue
- Example: 600 people × 10% = 60 customers × $15 = $900/day
Cost Estimate:
- Location fee (rent/permission): $X/month
- Permits/licenses: $Y/month
- Supplies/food: Z% of revenue (typically 25-35%)
Net Profit Estimate:
- ($900/day × 25 days/month) = $22,500 revenue
- Minus location ($1,000), permits ($200), supplies ($7,000)
- = ~$14,300/month profit potential
Rule of Thumb: Location should generate $800+/day to be worth pursuing.
STEP 5: Micro-Test (If Possible)
If permitted, run a 1-2 week trial:
- Operate at location for short period
- Track actual revenue vs projections
- Adjust assumptions based on real data
- Decision: Full commitment or abandon
Cost: 1-2 weeks trial vs 12+ months in wrong location
Common Location Mistakes (Learn From Others’ Failures)**
Mistake #1: “Beautiful Area” ≠ “Paying Customers”
You find a gorgeous beachfront spot. Aesthetic perfection.
But tourists there are on vacation budget. College students in beach town don’t spend on food trucks. Everyone made their own sandwiches.
→ High foot traffic but zero intent to buy.
Mistake #2: Competing With Established Chains
You start food truck next to Chipotle, Taco Bell, established restaurants.
Customers are already committed to those brands. You’re not different enough.
→ You become “invisible” despite high traffic.
Mistake #3: Underestimating Competition Impact
You count 3 other food trucks nearby. “That’s fine.”
But those 3 divide customer base. You get 25% of 100 customers instead of 100 customers.
Revenue cuts by 75%.
→ Smaller competition density is better.
Mistake #4: Relying On One Revenue Stream
You depend on lunch rush at office park. But summer? Holidays? Employees on vacation = zero revenue.
You needed backup locations (weekends, events, other areas).
→ Diversify location portfolio.
Mistake #5: Ignoring Operational Complexity
Location requires 45-minute commute. Permits take 6 months. Health inspector visits weekly.
Initial enthusiasm dies in operational grind.
→ Evaluate effort, not just revenue potential.
The Location Scout Checklist (Actionable)**
Use this checklist for ANY potential location:
TRAFFIC & DEMOGRAPHICS
☐ Estimated daily foot traffic: _____ people
☐ Target demographic present? (Yes/No/Partial)
☐ Time of peak traffic: _____ to _____
☐ Observation: Do people seem to stop and eat?
COMPETITION
☐ Number of food vendors within 200 feet: _____
☐ Types of competition: _________________
☐ Do their locations seem profitable? (Yes/No)
VISIBILITY & ACCESS
☐ Visible from street/parking? (Yes/No)
☐ Easy parking nearby? (Yes/No)
☐ Safe crossing/access? (Yes/No)
☐ Street parking for customers? (Yes/No)
REGULATIONS & PERMITS
☐ Food trailers allowed here? (Yes/No)
☐ Permits required: _____________
☐ Estimated permit cost: $
☐ Estimated permit timeline: _____ weeks
☐ Hour restrictions? ______ to ______
☐ Day restrictions? (Mon-Fri only, 7 days, etc)
FINANCIAL PROJECTION
☐ Conservative daily sales estimate: $______
☐ Location cost/month: $______
☐ Estimated monthly net profit: $______
☐ Breakeven timeline: _____ months
GUT CHECK
☐ Does this location feel right? (Yes/No/Uncertain)
☐ Are existing vendors honest about business? (Yes/No)
☐ Would you park here as a customer? (Yes/No)
☐ Can you sustain this 12+ months? (Yes/No)
DECISION: ☐ Pursue | ☐ Keep Scouting | ☐ Abandon
The Best Locations For 2026 (Emerging Opportunities)**
Trending Hot Spots:
1. Corporate Campus Lunch Programs
Tech companies/large corporations increasingly contracting food trucks for employee lunch programs. Guaranteed daily volume.
2. Event Sponsorships
Music festivals, sports events, outdoor concerts pre-booking food vendors. Growing segment with better profit margins.
3. College Campus Late-Night
11pm-2am service near college campuses (campus dining closes). Less competition, high demand.
4. Residential Neighborhood “Pop-Ups”
Suburban areas without food options. Host event weekly in parking lot. Underserved market.
5. Construction Site Catering
Breakfast/lunch service at active construction sites. Captive audience, high ticket, consistent.
Conclusion: Location Strategy Beats Everything Else
Your trailer is only 10% of the equation.
Your location is 60%.
The difference between success and failure isn’t about better food or prettier design. It’s about parking in the right place.
The entrepreneurs making $2,000+/day? They obsess over location first. Equipment second. Menu third.
Scout properly. Validate with data. Commit to locations with real traffic + real intent.
Your revenue will follow.
Ready to find your golden location?
The Fud Trailer has data from 19 dealerships across the USA. We know which location types work best for different menus, markets, and business models.
Plus get our “Top 10 Location Red Flags” guide so you avoid the mistakes that kill food trailer businesses.
Or consult directly with our location strategy team:
Schedule Location Strategy Consultation → Click Here
Your location can make or break your business. Get it right from day one.